An Observatory at Your Fingertips
October is American Archives Month—a time to celebrate the importance of archives across the country. In honor of Archives Month, we're participating in a pan-Smithsonian blogathon. Throughout October we, and other blogs from across the Smithsonian, will be blogging about Chandra's rich archive of astronomical data, issues, and behind-the-scenes projects.
----------------------------------------------------------------------------------------------------------------------------
Last week's blog post provided some insight into how an X-ray photon captured by Chandra makes its way into the archive, as well as how data sets can be discovered within the archive. This week, I'm going to get a little more technical, and discuss the different types of data found in the Chandra archive as well as some of the tools and techniques I use to work with archive data. For the especially motivated reader, this post could serve as a preamble to the openFITS tutorial for making your own Chandra images, and open up the list of potential images from the handpicked openFITS data sets to the entire Chandra archive!
The Chandra Data Archive (CDA) is the main interface between Chandra's vast archives of data and the community. The archive is open to the public so the 'community' includes both scientists and anyone interested in obtaining, and investigating Chandra data. The archive group provides several types of search and retrieval tools for interfacing with the archive. To those more familiar with Chandra and it's detectors, ChaSeR (Chandra Archive Search and Retrieval) and WebChaSeR are two great tools for accessing data based on very specific search criteria. ChaSeR is a downloadable stand-alone version of WebChaSeR. Both of these tools can be used to do broad searches based on sky position in RA and Dec (known as a cone search) as well as very targeted, Chandra-specific searches based on criteria such as the observation identifier number (OBSID), or detector configuration used.

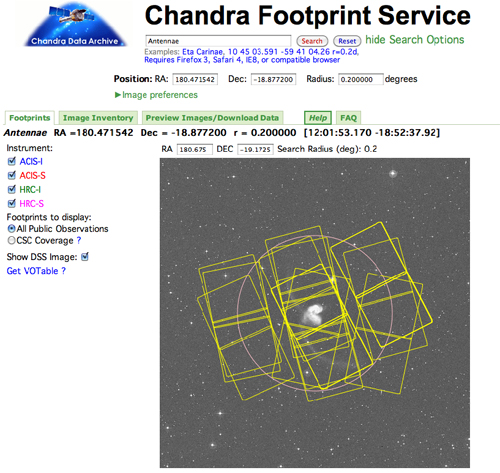
Perhaps a more user-friendly tool for someone not as familiar with the observatory, the Chandra Footprint Service provides searches on plain text target names (eg 'Antennae') as well as cone searches and shows the actual 'footprint' of the detector field of view overlaid on an optical image of the region of interest. This tool also allows the user to easily browse quicklook images of the data before downloading. Once you've identified an OBSID of interest, you can click on it and see more specific information about that particular observation as well as links to download the data products. For every OBSID in the archive, the user has the option of downloading the 'primary' and/or 'secondary' data products. For a casual user, looking for good image data from a single observation, the primary products are all that are needed. The secondary products are required if you intend to reprocess your data using the latest calibration data; they contain supporting files used to create the final data products. These data would also be necessary if you intended to combine data from multiple observations to create a mosaic image.
Once downloaded, you'll see that the data from the archive arrives in the Flexible Image Transport System format (FITS) with all files having a .fits extension (after uncompressing, of course). Your data package should contain a directory with the OBSID number, containing a folder named 'primary', as well as a validation and verification report (PDF) containing comments regarding the quality of the data set. Descending into the 'primary' directory, you'll notice a series of cryptically names files. Here's an example file from the archive: acisf09552N001_evt2.fits. The first few letters tell you which detector on Chandra was used for this particular observation (ACIS in this case), and that is followed by the OBSID number, followed by a number denoting which level of reprocessing this file has undergone. Finally, the characters before the .fits extension tell you which file type you're looking at, in this case the EVENTS file, which is the file that actually contains the detector data for this observation. It is called an EVENTS file because it is a time-ordered list detailing the precise location, time, and energy of every single X-ray photon ('event') collected during the observation. This information can be used to reconstruct the image of the source, or provide a histogram of the data, the X-ray spectrum. Now that we know what we're dealing with, we'll need some tools to unearth the mysteries within the data.

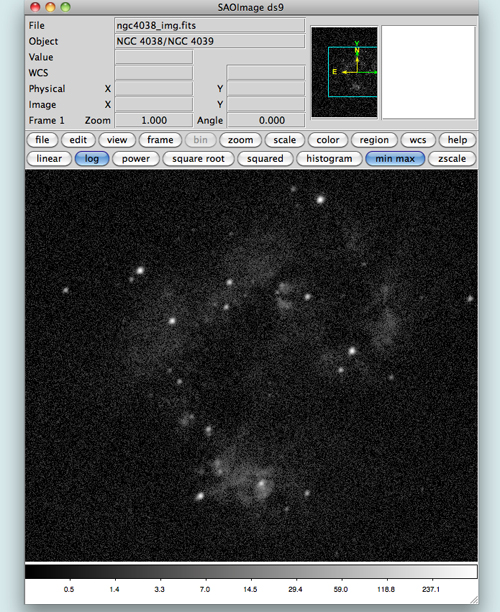
The Chandra X-ray Center has developed an extensive and well-documented command-line software package known as CIAO (Chandra Interactive Analysis of Observations) for analyzing X-ray data. This software is capable of reading, interpreting and manipulating fits files and is designed specifically with Chandra analysis in mind. CIAO, combined with SAOImage DS9 are the tools of the trade for working with the data. In particular, the CIAO tool 'dmcopy' is akin to a swiss army knife for data analysis. This tool can be used to slice and dice your data set in many different ways. As with any software package, there is a learning curve with these tools, but the excellent CIAO documentation can help with that. You could use either dmcopy on the command line, or the GUI interface of DS9 to convert your events data into an image that can then be processed in the photo editor of your choice (GIMP, Photoshop, etc). From here, I would advise you to learn more about the power of CIAO, and if you're up for it, check out the openFITS tutorial that walks you through step-by-step the process of creating a press quality image from Chandra data.
Armed with this bit of extra knowledge about the archive, combined with the openFITS tutorial, it should be possible for you to take advantage of what has truly become an observatory at your fingertips! As is becoming a traditional closing point in these blog posts, we owe a debt of gratitude to the scientists, engineers, and programmers responsible for not only the Chandra archive, but also the tools that allow us to efficiently examine and dig deep into Chandra's data. The next big discovery in X-ray astronomy could be sitting in the archive right now!
NOTE: See the recent Hubble discovery of extra solar planets from 13 year old data - http://hubblesite.org/newscenter/archive/releases/2011/29/full/
-Joseph DePasquale, Chandra EPO
PS: For those readers who would rather cut to the chase and view a raw telescope image directly from the archive in their web browser, the Chandra Data Archive group also provides a service known as POP for accessing quick pictures based on a name or location search. That service can be found here: http://cda.cfa.harvard.edu/pop/
Please note this is a moderated blog. No pornography, spam, profanity or discriminatory remarks are allowed. No personal attacks are allowed. Users should stay on topic to keep it relevant for the readers.
Read the privacy statement
