
CXC Home | Search | Help | Image Use Policy | Latest Images | Privacy | Accessibility | Glossary | Q&A
1
Optical Images of the
Antennae
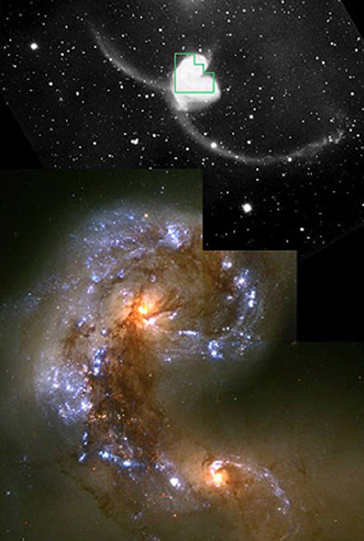
Left. An optical image of the Antennae galaxies
( NGC 4038/4039) - so named because a pair of long tails of luminous matter resembles an insect's antennae. The tails are caused by a collision between the galaxies, which is seen in more detail in the Hubble Space Telescope image on the right.
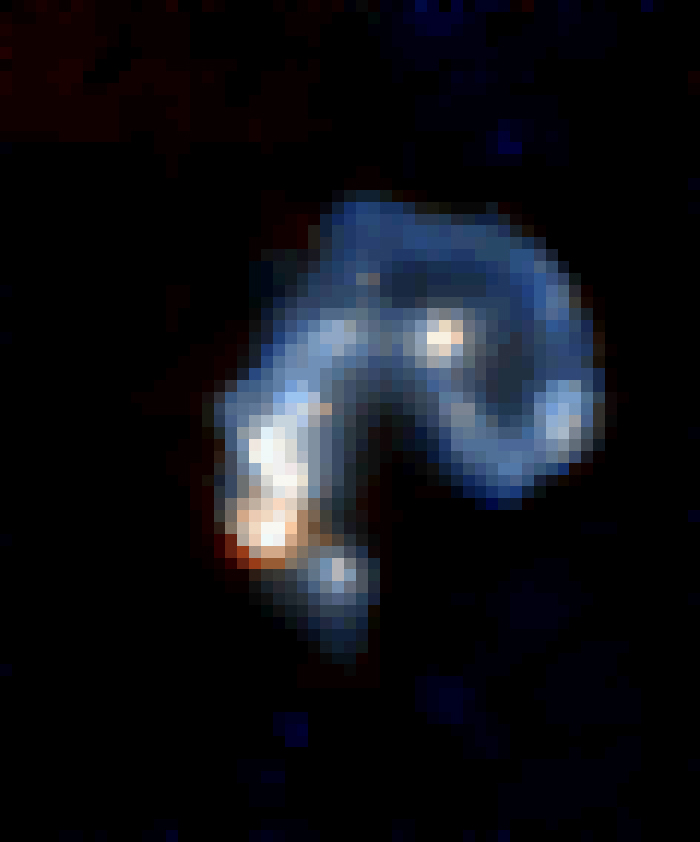
Right: The cores of the colliding galaxies (the orange blobs, left and right of image center) are connected by a dark, wide band of dust, The looping, spiral-like patterns traced by bright blue star clusters, show the result of a vigorous star formation triggered by the collision.
This natural-color image is a composite of four separately filtered images taken with the Wide Field Planetary Camera 2 (WFPC2), on January 20, 1996.
(Credit: NASA/STScI/B.Whitmore)
Left. An optical image of the Antennae galaxies
( NGC 4038/4039) - so named because a pair of long tails of luminous matter resembles an insect's antennae. The tails are caused by a collision between the galaxies, which is seen in more detail in the Hubble Space Telescope image on the right.
Right: The cores of the colliding galaxies (the orange blobs, left and right of image center) are connected by a dark, wide band of dust, The looping, spiral-like patterns traced by bright blue star clusters, show the result of a vigorous star formation triggered by the collision.
This natural-color image is a composite of four separately filtered images taken with the Wide Field Planetary Camera 2 (WFPC2), on January 20, 1996.
(Credit: NASA/STScI/B.Whitmore)
2
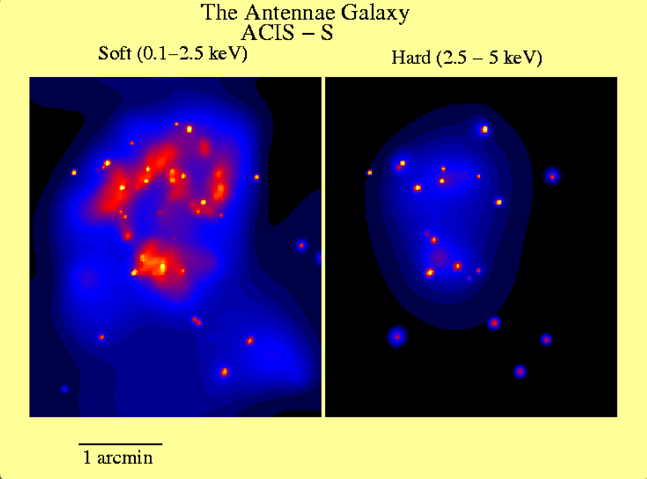
High and Low Energy X-Ray Images of
the Antennae
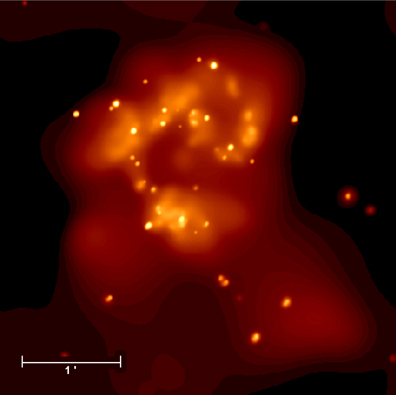
The high-energy or hard X-ray image (right) shows X rays from high temperature gas (25 million degree Celsius or more), whereas the low energy or soft X-ray image (left) is produced mainly by gas at temperatures of 1 to 25 million degrees Celsius. Note that the point-like sources, which are produced by neutron stars and black holes pulling gas off nearby stars, stand out in the hard X-ray image, whereas the superbubbles formed by the merging of many supernova remnants, are prominent in the soft X-ray image. The colors represent X-ray intensities, with yellow the most intense, then red, then blue.
Chandra ACIS image.
(Credit: NASA/SAO/CXC/G.Fabbiano et al.)
3
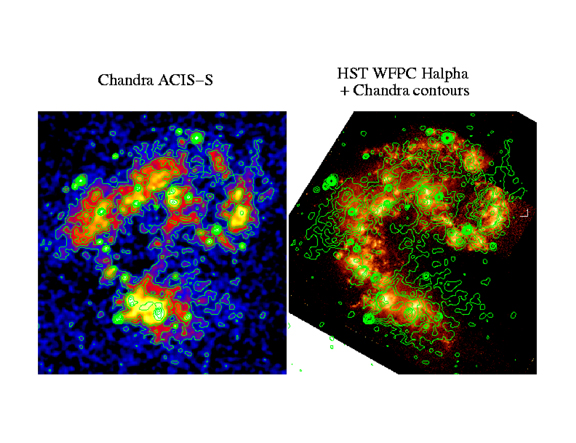
Chandra-Hubble Comparison for the
Antennae
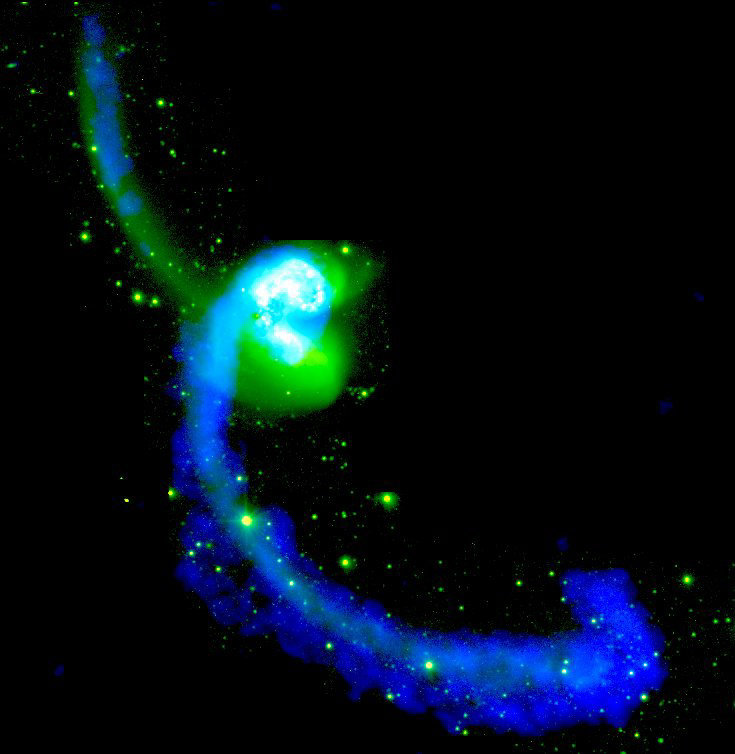
In the image on the left, the contours represent X-ray intensity. The colors also represent X-ray intensity, with white the brightest, then yellow, red and blue. In the image on the right, the X-ray contours from Chandra are overlaid on a Hubble Space Telescope image.
Scale: Images are 2.5 arcmin on a side.
(Credit: Chandra: NASA/SAO/CXC/G.Fabbiano
Hubble: NASA/STScI/B.Whitmore)
4
5
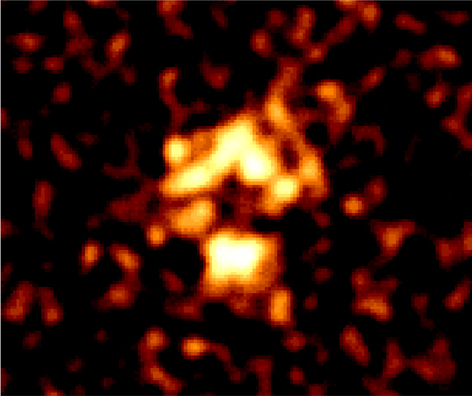
ISO Infrared Image of
Antennae
This infrared image, taken by the European Space Agency's Iinfrared Space Observatory, shows gas and dust heated to several hundred degrees by young stars. One of the Antennae galaxies shows a large ring of intense starmaking around the central nucleus. This feature is absent in the other galaxy. Another region of star formation extends along a line marking the overlap of the disks of the two galaxies, where the collision is strongest.
Scale: Image is 13.7 arcmin on a side.
(Credit: ESA/ISO/L.Vigroux et al.)
6
7
Return to The Antennae (NGC4038/4039) (16 Aug 00)

Revised: May 17, 2022