
CXC Home | Search | Help | Image Use Policy | Latest Images | Privacy | Accessibility | Glossary | Q&A
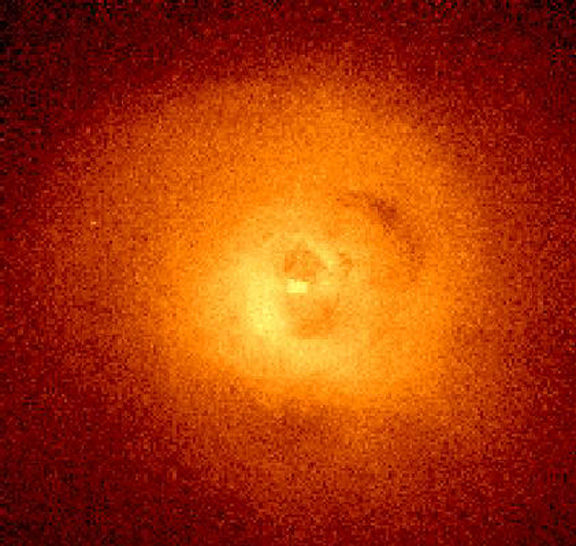
1
Smoothed X-ray image of the Perseus
cluster
The colors represent variations in the intensity not temperature-- of the X rays, with white being the most intense, to red being the least. The red and orange show X-ray emitting gas in the cluster. The more intense yellow and white regions are in and around the supergiant galaxy, Perseus A. A small dark patch located at two o'clock from the center of the image is a galaxy with "only" about 20 billion stars that is falling into Perseus A. Another larger hole seen further out is thought to be due to a bubble of high energy particles ejected in an explosion from Perseus A hundreds of millions of years ago. The central region is discussed at Perseus A Photo Album.
Scale: Image is 6 arcmin ( 600,000 light years) on a side.
Chandra X-ray Observatory ACIS Image
(Credit: NASA/IoA/A.Fabian et al.)
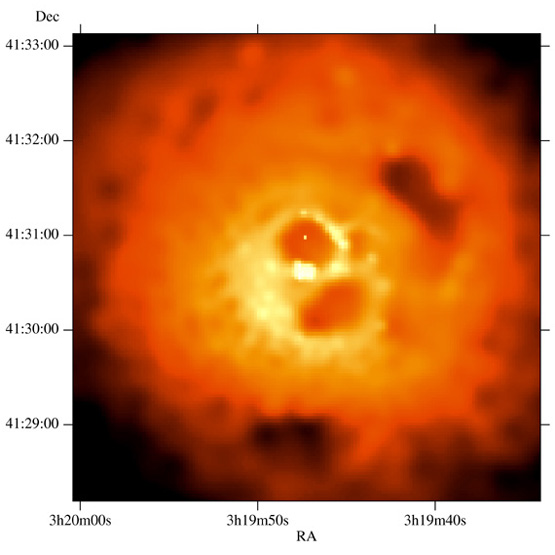
2
Unsmoothed X-ray image of the
Perseus cluster
The colors represent variations in the intensity of the X rays, with white being the most intense. For a discussion of the details see above.
Scale: Image is 6.5 arcmin (640,000 light years) on a side.
Chandra X-ray Observatory ACIS Image
(Credit: NASA/IoA/A.Fabian et al.)
The colors represent variations in the intensity of the X rays, with white being the most intense. For a discussion of the details see above.
Scale: Image is 6.5 arcmin (640,000 light years) on a side.
Chandra X-ray Observatory ACIS Image
(Credit: NASA/IoA/A.Fabian et al.)
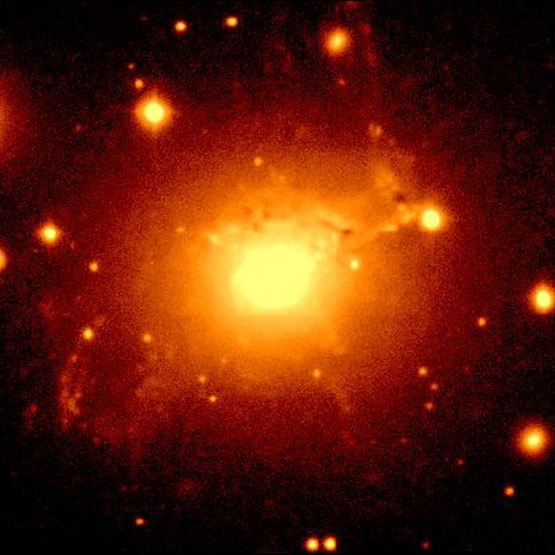
3
Optical image of Perseus A (NGC
1275)
The large central galaxy in the Perseus cluster. The infalling galaxy is the irregular shape at two o'clock.
Scale: Image is 150 arcsec (240,000 light years) on a side.
Optical image from Jacobus Kapteyn Telescope (JKT)
(Credit: JKT/ING)
The large central galaxy in the Perseus cluster. The infalling galaxy is the irregular shape at two o'clock.
Scale: Image is 150 arcsec (240,000 light years) on a side.
Optical image from Jacobus Kapteyn Telescope (JKT)
(Credit: JKT/ING)
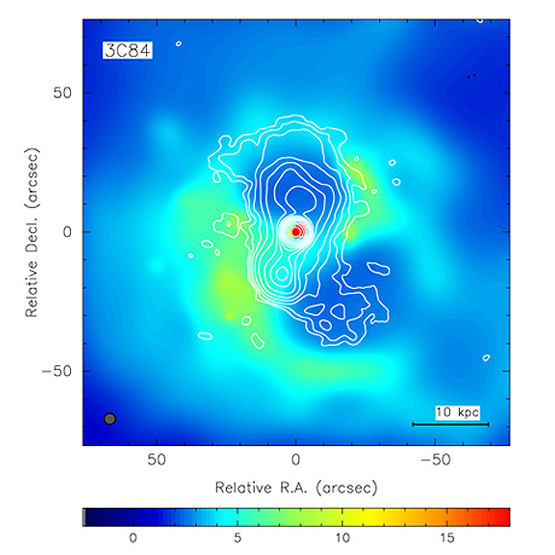
4
Radio Image of Perseus A
Very Large Array radio image (contours) overlaid on Chandra X-ray image of Perseus cluster. The colors represent intensity of X-rays, with red being the brightest and blue the faintest.
Scale: as shown: (1 kpc = 3,260 light years)
(Credit: Radio: NRAO/AUI/NSF; X-ray: NASA/IoA/A.Fabian et al.)
Very Large Array radio image (contours) overlaid on Chandra X-ray image of Perseus cluster. The colors represent intensity of X-rays, with red being the brightest and blue the faintest.
Scale: as shown: (1 kpc = 3,260 light years)
(Credit: Radio: NRAO/AUI/NSF; X-ray: NASA/IoA/A.Fabian et al.)
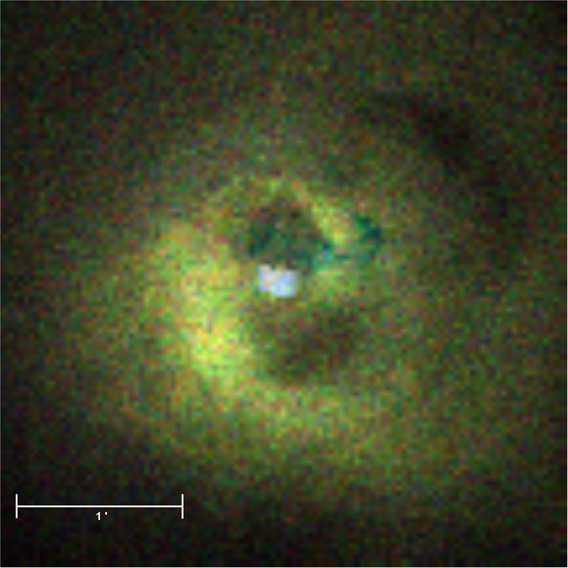
5
Chandra X-ray Image with Scale
Bar
Scale bar = 1 arcmin
(Credit: NASA/IoA/A.Fabian et al.)
Scale bar = 1 arcmin
(Credit: NASA/IoA/A.Fabian et al.)
Return to Perseus A (07 Jun 00)

Revised: July 08, 2008