For Release: August 31, 2022
NASA/STScI
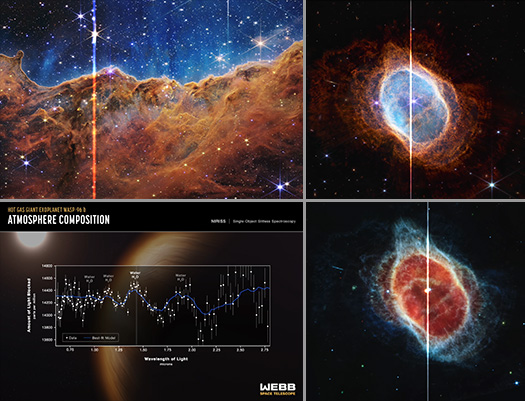
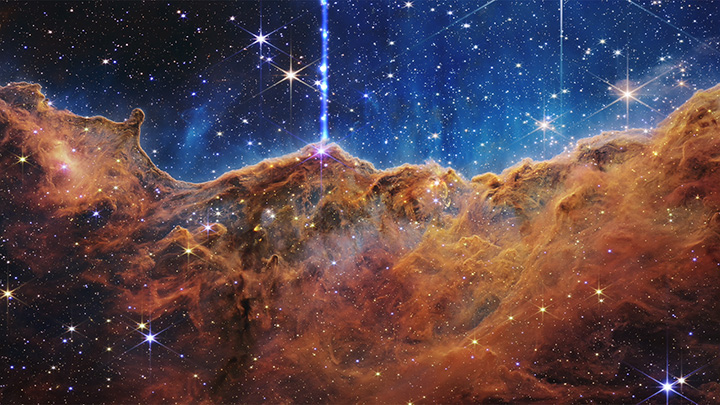
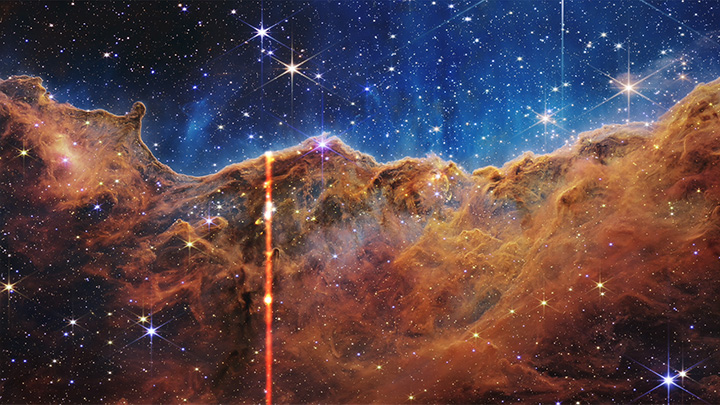
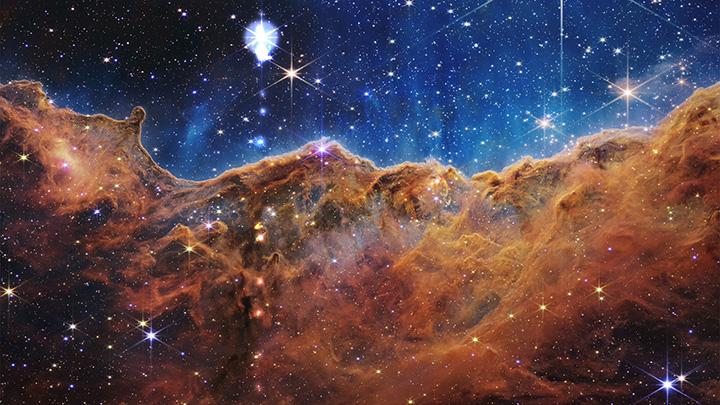
[Top Left] Carina Nebula, [Top Right] Southern Ring Nebula (NIRCam),
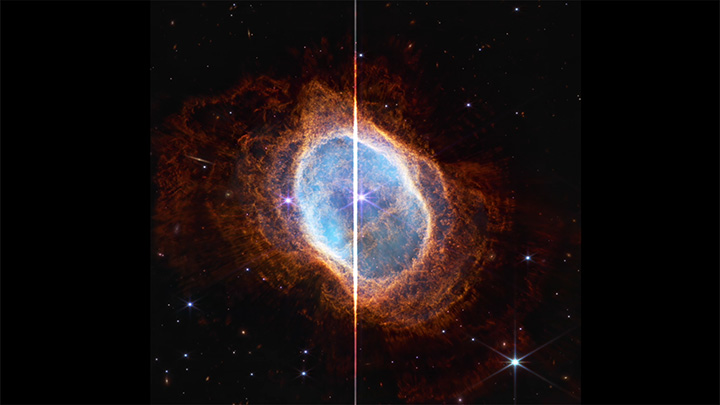
[Bottom Left] WASP-96 b, [Bottom Right] Southern Ring Nebula (MIRI)
Sonification Credit: NASA, ESA, CSA, STScI, and Kim Arcand (CXC/SAO), Matt Russo & Andrew
Santaguida (SYSTEM Sounds), Quyen Hart (STScI), Claire Blome (STScI), and Christine Malec (consultant).
Image Credit: NASA, ESA, CSA, and STScI
There’s a new, immersive way to explore some of the first full-color infrared images and data from NASA’s James Webb Space Telescope — through sound. Listeners can enter the complex soundscape of the Cosmic Cliffs in the Carina Nebula, explore the contrasting tones of two images that depict the Southern Ring Nebula, and identify the individual data points in a transmission spectrum of hot gas giant exoplanet WASP-96 b.
A team of scientists, musicians, and a member of the blind and visually impaired community worked to adapt Webb’s data, with support from the Webb mission and NASA’s Universe of Learning. “Music taps into our emotional centers,” said Matt Russo, a musician and physics professor at the University of Toronto. “Our goal is to make Webb’s images and data understandable through sound — helping listeners create their own mental images.”
These audio tracks support blind and low-vision listeners first, but are designed to be captivating to anyone who tunes in. “These compositions provide a different way to experience the detailed information in Webb’s first data. Similar to how written descriptions are unique translations of visual images, sonifications also translate the visual images by encoding information, like color, brightness, star locations, or water absorption signatures, as sounds,” said Quyen Hart, a senior education and outreach scientist at the Space Telescope Science Institute in Baltimore, Maryland. “Our teams are committed to ensuring astronomy is accessible to all.”
This project has parallels to the “curb-cut effect,” an accessibility requirement that supports a wide range of pedestrians. “When curbs are cut, they benefit people who use wheelchairs first, but also people who walk with a cane and parents pushing strollers,” explained Kimberly Arcand, a visualization scientist at the Chandra X-ray Center in Cambridge, Massachusetts, who led the initial data sonification project for NASA and now works on it on behalf of NASA’s Universe of Learning. “We hope these sonifications reach an equally broad audience.”
Preliminary results from a survey Arcand led showed that people who are blind or low vision, and people who are sighted, all reported that they learned something about astronomical images by listening. Participants also shared that auditory experiences deeply resonated with them. “Respondents’ reactions varied — from experiencing awe to feeling a bit jumpy,” Arcand continued. “One significant finding was from people who are sighted. They reported that the experience helped them understand how people who are blind or low vision access information differently.”
These tracks are not actual sounds recorded in space. Instead, Russo and his collaborator, musician Andrew Santaguida, mapped Webb’s data to sound, carefully composing music to accurately represent details the team would like listeners to focus on. In a way, these sonifications are like modern dance or abstract painting — they convert Webb’s images and data to a new medium to engage and inspire listeners.
Christine Malec, a member of the blind and low vision community who also supports this project, said she experiences the audio tracks with multiple senses. “When I first heard a sonification, it struck me in a visceral, emotional way that I imagine sighted people experience when they look up at the night sky.”
There are other profound benefits to these adaptations. “I want to understand every nuance of sound and every instrument choice, because this is primarily how I’m experiencing the image or data,” Malec continued. Overall, the team hopes that sonifications of Webb’s data help more listeners feel a stronger connection to the universe — and inspire everyone to follow the observatory’s upcoming astronomical discoveries.
The James Webb Space Telescope is the world's premier space science observatory. Webb will solve mysteries in our solar system, look beyond to distant worlds around other stars, and probe the mysterious structures and origins of our universe and our place in it. Webb is an international program led by NASA with its partners, ESA (European Space Agency) and CSA (Canadian Space Agency).
These sonifications are a result of a collaboration between the NASA’s Universe of Learning program and the James Webb Space Telescope. The Chandra X-ray Center (CXC) leads data sonification as a NASA’s Universe of Learning partner. Science experts affiliated with the Webb mission provide their expertise on Webb observations, data, and targets.
NASA's Universe of Learning is part of the NASA Science Activation program, from the Science Mission Directorate at NASA Headquarters. The Science Activation program connects NASA science experts, real content and experiences, and community leaders in a way that activates minds and promotes deeper understanding of our world and beyond. Using its direct connection to the science and the experts behind the science, NASA's Universe of Learning provides resources and experiences that enable youth, families, and lifelong learners to explore fundamental questions in science, experience how science is done, and discover the universe for themselves.
NASA's Universe of Learning materials are based upon work supported by NASA under cooperative agreement award number NNX16AC65A to the Space Telescope Science Institute, working in partnership with Caltech/IPAC, Center for Astrophysics | Harvard & Smithsonian, and Jet Propulsion Laboratory.
Sonification Credit: NASA, ESA, CSA, STScI, and Kim Arcand (CXC/SAO), Matt Russo & Andrew Santaguida (SYSTEM Sounds), Quyen Hart (STScI), Claire Blome (STScI), and Christine Malec (consultant); Image Credit: NASA, ESA, CSA, and STScI
[Runtime: 00:36]
 Audio Only Versions
Video Description:
New sonifications map a near-infrared image of the Cosmic Cliffs in the Carina Nebula, captured by NASA’s Webb Telescope, to a symphony of sounds. Musicians assigned unique notes to the semi-transparent, gauzy regions and very dense areas of gas and dust in the nebula, culminating in a buzzing soundscape.
The sonification scans the image from left to right. The new sounds were also adapted to a video, allowing sighted viewers to watch as a vertical line moves across the frame.
The soundtrack is vibrant and full, representing the detail in this gigantic, gaseous cavity that has the appearance of a mountain range. The Carina Nebula is a large cloud of gas and dust where stars are forming or have already formed.
The gas and dust in the top half of the image are represented in blue hues and windy, drone-like sounds. The bottom half of the image, represented in ruddy shades of orange and red, has a clearer, more melodic composition.
Brighter light in the image is louder. The vertical position of light also dictates the frequency of sound. For example, bright light near the top of the image sounds loud and high, but bright light near the middle is loud and lower pitched. Dimmer, dust-obscured areas that appear lower in the image are represented by lower frequencies and clearer, undistorted notes.
The separate tracks below more easily pick out the meandering melodic line that represents the nebula’s “mountain range” as it rises and falls in the image, through the center of the frame, from left to right. This jagged line between denser and thinner areas of gas and dust is the arc of the sonification’s melody. All stars are represented by a combination of pitches and processed piano notes, but the brightest stars with longer diffraction spikes also carry crashes and clangs from cymbals.
Several files appear below for download: The first represents the entire image. The second only includes sounds from the top portion of the image, and the third file only includes sounds from the bottom half of the image. Listen to the second and third files to discern the “mountain top” feature in the image. A fourth file only plays the notes that represent stars. Listen to all of the tracks for a more complex understanding of how sounds were adapted to Webb’s image of the Cosmic Cliffs.
This sonification does not represent sounds recorded in space. Two musicians mapped the telescope’s data to sound, carefully composing music to accurately represent details the team would like listeners to focus on. In a way, this sonification is like modern dance or an impressionist painting – it converts Webb’s image to a new medium to engage and inspire listeners.
Explore Webb’s image of the Cosmic Cliffs, including its full text description, in more detail.
Sonification Credit: NASA, ESA, CSA, STScI, and Kim Arcand (CXC/SAO), Matt Russo & Andrew Santaguida (SYSTEM Sounds), Quyen Hart (STScI), Claire Blome (STScI), and Christine Malec (consultant); Image Credit: NASA, ESA, CSA, and STScI
[Runtime: 01:00]
 Audio Only Versions
Video Description:
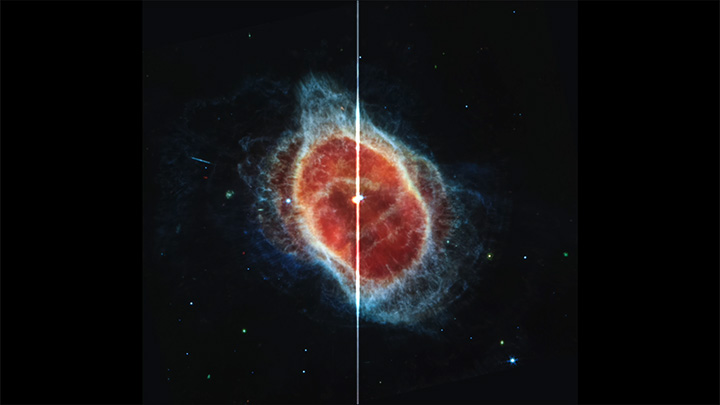
NASA’s Webb Telescope uncovered two views of the Southern Ring Nebula — in near-infrared light (at left) and mid-infrared light (at right) — and each has been adapted to sound.
Two stars orbit one another at the center of this planetary nebula. The smaller, fainter red star in the mid-infrared image at right is at the end of its lifetime — it has puffed off layers of gas and dust for thousands of years. Its companion, the brighter, larger star in both images, has stirred up those ejections. Now, listeners can hear the stars and surrounding shells of material in each image clearly.
In this sonification, the colors in the images were mapped to pitches of sound — frequencies of light converted directly to frequencies of sound. Near-infrared light is represented by a higher range of frequencies at the beginning of the track. Mid-way through, the notes change, becoming lower overall to reflect that mid-infrared includes longer wavelengths of light.
Listen carefully at 15 seconds and 44 seconds. These notes align with the centers of the near- and mid-infrared images, where the stars at the center of the “action” appear. In the near-infrared image that begins the track, only one star is heard clearly, with a louder clang. In the second half of the track, listeners will hear a low note just before a higher note, which denotes that two stars were detected in mid-infrared light. The lower note represents the redder star that created this nebula, and the second is the star that appears brighter and larger.
This sonification does not represent sounds recorded in space. Two musicians mapped the telescope’s data to sound, carefully composing music that represents near- and mid-infrared light, specifically to hear their contrasts. In a way, this sonification is like modern dance or an abstract painting — it converts two of Webb’s images into a new medium to engage and inspire listeners.
Explore Webb’s image of the Southern Ring Nebula, including its full text description, in more detail.
Sonification Credit: NASA, ESA, CSA, STScI, and Kim Arcand (CXC/SAO), Matt Russo & Andrew Santaguida (SYSTEM Sounds), Quyen Hart (STScI), Claire Blome (STScI), and Christine Malec (consultant); Image Credit: NASA, ESA, CSA, and STScI
[Runtime: 00:21]
 Audio Only Version
Video Description:
NASA’s Webb Telescope observed the atmospheric characteristics of the hot gas giant exoplanet WASP-96 b — which contains clear signatures of water — and the resulting transmission spectrum’s individual data points were translated into sound.
The sonification scans the spectrum from left to right. From bottom to top, the y-axis ranges from less to more light blocked. The x-axis ranges from 0.6 microns on the left to 2.8 microns on the right. The pitches of each data point correspond to the frequencies of light each point represents. Longer wavelengths of light have lower frequencies and are heard as lower pitches. The volume indicates the amount of light detected in each data point. The new sounds were also adapted to a video, allowing sighted viewers to watch the progression as the vertical line moves across the graph, ringing out a musical note for each data point.
The four water signatures are represented by the sound of water droplets falling. These sounds simplify the data — water is detected as a signature that has multiple data points. The sounds align only to the highest points in the data.
This sonification does not represent sounds recorded in space. Two musicians converted Webb’s transmission spectrum to musical pitches to help listeners hear its data.
Explore Webb’s transmission spectrum of hot gas giant exoplanet WASP-96 b in more detail, including its full text description and data download.
| MP3 | OGG | M4R | |
|---|---|---|---|
| MP3 | OGG | M4R | |
| All | .mp3 | .ogg | .m4r |
| Top of Image | .mp3 | .ogg | .m4r |
| Bottom of Image | .mp3 | .ogg | .m4r |
| Stars Only | .mp3 | .ogg | .m4r |
| MP3 | OGG | M4R | |
|---|---|---|---|
| All | .mp3 | .ogg | .m4r |
| Near-Infrared Image (NIRCam) | .mp3 | .ogg | .m4r |
| Mid-Infrared Image (MIRI) | .mp3 | .ogg | .m4r |
| MP3 | OGG | M4R | |
|---|---|---|---|
| Transmission Spectrum | .mp3 | .ogg | .m4r |
Media Contact:
Megan Watzke
Chandra X-ray Center, Cambridge, Massachusetts
617-496-7998
mwatzke@cfa.harvard.edu


