Sagittarius A* Sonification
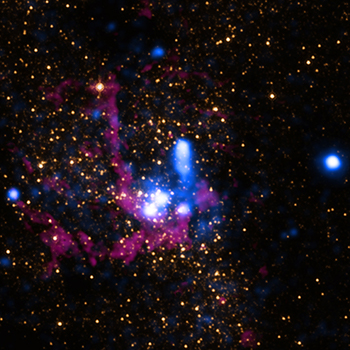
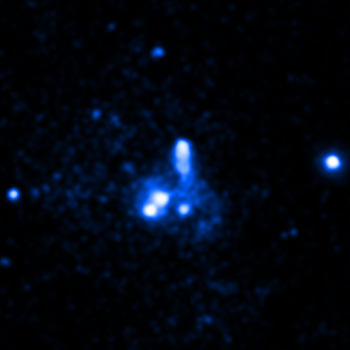
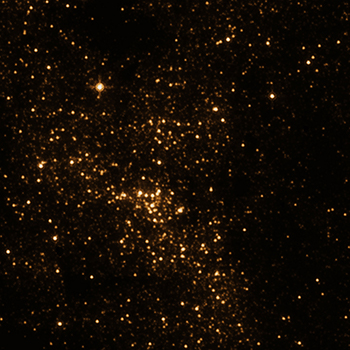
This image shows the region around the Milky Way's central supermassive black hole, known as Sagittarius A* (Sgr A*), in infrared (orange and purple) and X-ray light (blue). The image is scanned from left to right and the data are transformed into sound. The brightness of the objects is represented by the volume, while the vertical positions of the sources in the image are mapped to musical pitches. X-rays are played with a soft synthesizer and the infrared data are heard as bass notes and plucked sounds. The brightest region in the middle of the image (and hence the loudest) is where Sgr A* the black hole, resides. It is within this area that the Event Horizon Telescope was able to peer to obtain the first image of Sgr A* itself.
Access more information & file formats on this sonification
The Chandra sonifications were led by the Chandra X-ray Center (CXC), with input from NASA's Universe of Learning. The sustained collaboration was driven by visualization scientist Dr. Kimberly Arcand (CXC), astrophysicist Dr. Matt Russo and musician Andrew Santaguida (both of the SYSTEM Sounds project). For other sonifications, please see their linked pages.
cxcpub@cfa.harvard.edu
617-496-7941
60 Garden Street,
Cambridge, MA 02138 USA
Art Direction/Design: Kristin DiVona
Web Developers: Khajag Mgrdichian
& Kelly T.S. Williamson
Chandra X-ray Center, Operated for NASA by the Smithsonian Astrophysical Observatory. This site was developed with funding from NASA under contract NAS8-03060 | Privacy | Accessibility
Additional support from NASA's Universe of Learning (UoL). UoL materials are based upon work supported by NASA under award number NNX16AC65A to the Space
Telescope Science Institute, working in partnership with Caltech/IPAC, Jet Propulsion Laboratory, and Smithsonian Astrophysical Observatory.


